Performance of Containerized Spring Boot on Lambda
[post-meta]
During AWS Re:invent 2020 Container Image support for AWS Lambda was announced, giving us a new way to deploy our code to AWS Lambda. In our recent post, we showed what is needed to modify an application to run as a ‘Lambda Container’. One clear advantage of the new Container Deployments is that we are no longer limited by the 50MB limit of the deployment zip, but now have an impressive 10GB to work with. Furthermore, we can include any other program we could run in a Docker container, rather than being limited by our runtime. One use case for this is running your machine learning models in a serverless fashion, and more use cases will undoubtedly be found in the coming months! But what is the performance like? Will we have to make a tradeoff between deployment flexibility and response time? For many user-facing applications, such as a public API, having a low response time is very important – both on cold starts and on subsequent runs. As it turns out, you can deploy your Java application as a Container instead of as Code without serious performance repercussions. To do this, we will use the application we made before to measure both the cold start and the reused instance performance, and compare the overhead Lambda adds for a Container Deployment and a traditional Code Deployment.
The problem: cold starts
A major impact of working with a serverless application is the cold start time. Whenever your application needs to scale out and add more instances due to increased demand, the instance that will serve that request still needs to be initialized. Therefore, that first request will take longer than subsequent requests. How much longer typically depends on the runtime of the application. While runtimes like Python and Node can often start serving requests in a few hundred milliseconds, Java applications are somewhat notorious for several seconds of cold start time. It depends on your use case if this cold start time matters to you or not. If it’s meant to asynchronously process uploaded images, it might not matter if there’s 30 seconds of delay. An internal tool for your company can likely get away with several seconds of cold start time. But if it’s serving the frontend of your website, you will likely lose customers if the response time is that long. There are several ways to mitigate this. Possibly the most obvious one is avoiding cold starts altogether, by configuring provisioned concurrency for your Lambda function. Alternatively, you can decrease the size of your package by minimizing dependencies. An even better option could be to write your application in a language with better cold-start performance like Python, but that won’t be an option for every team. What we’re going to find out here is if deploying your code as a Container impacts the cold start time of your application.
The experiment
To analyze the performance of both deployment types, we will measure the duration of a request from initialization (before our application has started) to the end of the request. Furthermore, we want to distinguish cold starts from requests served by running instances. That way, we can compare the duration of a request handled by either a new or reused instance for both deployment methods.
The application
The application we use for this experiment is a Java 11 application created from AWSLabs’ Serverless Application Examples, giving us an application with a Handler class that can proxy API Gateway proxy requests to a Spring Boot application. The endpoint we will be calling performs a simple mathematical operation and sleeps for a second, to simulate a slow request. This is to encourage Lambda to launch multiple instances because the older one is not ready to handle another request yet. The @RequestMapping of our single controller contains an Environment variable LAMBDA_RUN_METHOD. This variable has been set to plain or container for the Code Deployment and Container Deployment, respectively. This means that the container deployment will have an effective RequestMapping of /container/slow, and the code deployment will have a RequestMapping /plain/slow.
@RestController public class SimpleEndpointController {
 @RequestMapping(value = "${LAMBDA_RUN_METHOD:local}/slow") public double handleBenchmarkRequest() throws InterruptedException { Thread.sleep(1000); return Math.tan(Math.atan(Math.tan(Math.atan(Math.tan(Math.atan(Math.random())))))); } }
The Container Deployment uses an openjdk:12 base image. Picking a Java SDK could have a large impact on your application performance. When deploying your application as code, AWS uses the Corretto JDK. This could also explain at least some difference in performance between both deployments we’re testing here.
Measuring performance
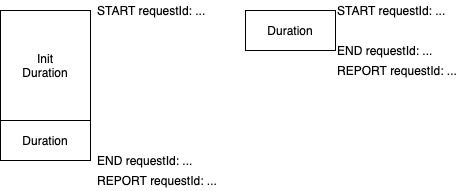
When a Lambda function is executed, lines similar to the following will always be logged to CloudWatch:
START RequestId: cfd95a67-7e38-4eed-b78b-5d971d89c84a Version: $LATEST ... END RequestId: cfd95a67-7e38-4eed-b78b-5d971d89c84a REPORT RequestId: cfd95a67-7e38-4eed-b78b-5d971d89c84a Duration: 1007.33 ms (...) Init Duration: 5101.71 msImportant for us here is the REPORT line after our execution ends. It includes the Duration, and the Init Duration if it was a cold start.
Generating traffic
Now that we have a system in place to measure startup time of new Lambda instances, it is time to make sure a number of them are launched. We used the load testing tool Artillery to send varying traffic to the endpoint of both deployments. It is a tool that takes a YAML file defining the endpoints to hit along with the level of load, optionally in various stages. In our case, we have 2 endpoints: /plain/slow and /container/slow. These should be hit randomly, but (approximately) the same amount of times. Because we added a Thread.sleep(1000) to the endpoint, we know every request will take at least 1 second – but likely not much longer once an instance has been warmed. We can expect that, the more requests we send every second, the more Lambda instances will be launched – but only when the current number of current instances is insufficient. In 3 phases, we slowly increase the load. We start out with 1 request per second, then 5 requests per second, and finally 20 requests per second. Each of these phases takes 5 minutes – which is plenty to ensure the number of container instances is stable.
Results
We downloaded the logs from CloudWatch and used a Python script to find request durations and group the cold starts and reused instances. We then used the Plotly Python Graphing library to plot the duration of each request, so we can compare the two groups.
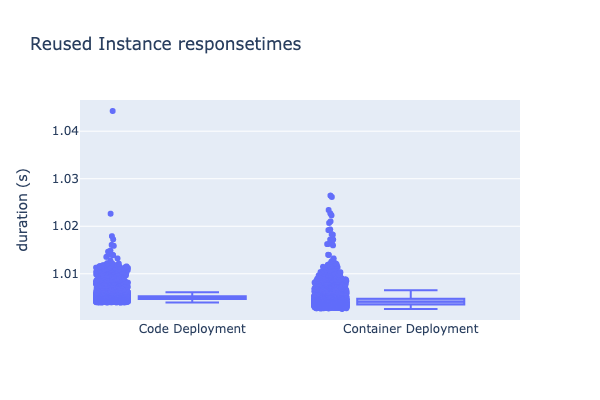
The response times of reused Lambda instances is comparable. Both the Code and the Container Deployments had a consistent request duration, handling all requests in just over 1 second. This makes sense, as we explicitly sleep for 1 second during the request.
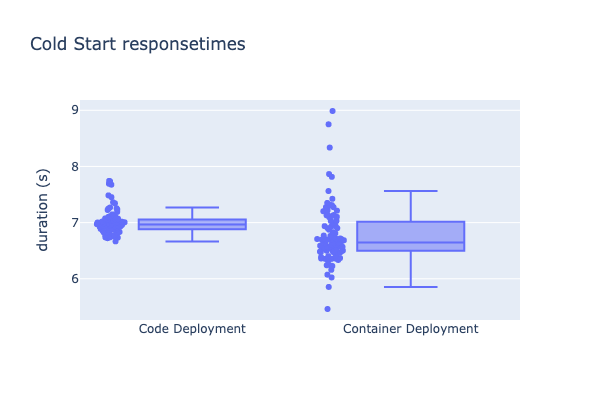
When comparing the cold start times, the results are more surprising! On average, the Container Deployment seems to perform slightly better than the Code Deployment, at the cost of consistency. Where 95% of the requests for the Code Deployment are in the range of 6.7-7.25 seconds, the Container Deployment had a much wider variance: from 5.9 to 7.5 seconds. In both cases, the startup time is quite long, for which Java is somewhat notorious.
Conclusions
A simple Java application has very similar performance on AWS Lambda when deployed as a Container or as code. Both Container and Code Deployments were able to consistently handle subsequent requests quickly, but the cold start response time is still several seconds long – which might be too much if your application requires fast response times. If you can deal with the occasional longer request, developing your Lambda application might be easier with a Container deployment. Being able to invoke your Lambda function locally can speed up development and debugging, and you have full control over the environment your application runs in. For applications where this delay does matter, be sure to run your own tests, especially if you have a different runtime. If the difference is negligible, the container deployment is likely superior due to the added ease of development. The testing methodology used in this blog should easily carry over to larger applications and runtimes. This release opens up a whole new set of options. Whether you want a consistent environment, port existing applications, deploy your on different runtimes or deploy your machine learning model to a serverless environment, the release of Containers on Lambda will be a game changer for serverless development in many teams!
[post-meta]Performance of Containerized Spring Boot on Lambda
[post-meta]
During AWS Re:invent 2020 Container Image support for AWS Lambda was announced, giving us a new way to deploy our code to AWS Lambda. In our recent post, we showed what is needed to modify an application to run as a ‘Lambda Container’. One clear advantage of the new Container Deployments is that we are no longer limited by the 50MB limit of the deployment zip, but now have an impressive 10GB to work with. Furthermore, we can include any other program we could run in a Docker container, rather than being limited by our runtime. One use case for this is running your machine learning models in a serverless fashion, and more use cases will undoubtedly be found in the coming months! But what is the performance like? Will we have to make a tradeoff between deployment flexibility and response time? For many user-facing applications, such as a public API, having a low response time is very important – both on cold starts and on subsequent runs. As it turns out, you can deploy your Java application as a Container instead of as Code without serious performance repercussions. To do this, we will use the application we made before to measure both the cold start and the reused instance performance, and compare the overhead Lambda adds for a Container Deployment and a traditional Code Deployment.
The problem: cold starts
A major impact of working with a serverless application is the cold start time. Whenever your application needs to scale out and add more instances due to increased demand, the instance that will serve that request still needs to be initialized. Therefore, that first request will take longer than subsequent requests. How much longer typically depends on the runtime of the application. While runtimes like Python and Node can often start serving requests in a few hundred milliseconds, Java applications are somewhat notorious for several seconds of cold start time. It depends on your use case if this cold start time matters to you or not. If it’s meant to asynchronously process uploaded images, it might not matter if there’s 30 seconds of delay. An internal tool for your company can likely get away with several seconds of cold start time. But if it’s serving the frontend of your website, you will likely lose customers if the response time is that long. There are several ways to mitigate this. Possibly the most obvious one is avoiding cold starts altogether, by configuring provisioned concurrency for your Lambda function. Alternatively, you can decrease the size of your package by minimizing dependencies. An even better option could be to write your application in a language with better cold-start performance like Python, but that won’t be an option for every team. What we’re going to find out here is if deploying your code as a Container impacts the cold start time of your application.
The experiment
To analyze the performance of both deployment types, we will measure the duration of a request from initialization (before our application has started) to the end of the request. Furthermore, we want to distinguish cold starts from requests served by running instances. That way, we can compare the duration of a request handled by either a new or reused instance for both deployment methods.
The application
The application we use for this experiment is a Java 11 application created from AWSLabs’ Serverless Application Examples, giving us an application with a Handler class that can proxy API Gateway proxy requests to a Spring Boot application. The endpoint we will be calling performs a simple mathematical operation and sleeps for a second, to simulate a slow request. This is to encourage Lambda to launch multiple instances because the older one is not ready to handle another request yet. The @RequestMapping of our single controller contains an Environment variable LAMBDA_RUN_METHOD. This variable has been set to plain or container for the Code Deployment and Container Deployment, respectively. This means that the container deployment will have an effective RequestMapping of /container/slow, and the code deployment will have a RequestMapping /plain/slow.
@RestController public class SimpleEndpointController {
 @RequestMapping(value = "${LAMBDA_RUN_METHOD:local}/slow") public double handleBenchmarkRequest() throws InterruptedException { Thread.sleep(1000); return Math.tan(Math.atan(Math.tan(Math.atan(Math.tan(Math.atan(Math.random())))))); } }
The Container Deployment uses an openjdk:12 base image. Picking a Java SDK could have a large impact on your application performance. When deploying your application as code, AWS uses the Corretto JDK. This could also explain at least some difference in performance between both deployments we’re testing here.
Measuring performance
When a Lambda function is executed, lines similar to the following will always be logged to CloudWatch:
START RequestId: cfd95a67-7e38-4eed-b78b-5d971d89c84a Version: $LATEST ... END RequestId: cfd95a67-7e38-4eed-b78b-5d971d89c84a REPORT RequestId: cfd95a67-7e38-4eed-b78b-5d971d89c84a Duration: 1007.33 ms (...) Init Duration: 5101.71 msImportant for us here is the REPORT line after our execution ends. It includes the Duration, and the Init Duration if it was a cold start.
Generating traffic
Now that we have a system in place to measure startup time of new Lambda instances, it is time to make sure a number of them are launched. We used the load testing tool Artillery to send varying traffic to the endpoint of both deployments. It is a tool that takes a YAML file defining the endpoints to hit along with the level of load, optionally in various stages. In our case, we have 2 endpoints: /plain/slow and /container/slow. These should be hit randomly, but (approximately) the same amount of times. Because we added a Thread.sleep(1000) to the endpoint, we know every request will take at least 1 second – but likely not much longer once an instance has been warmed. We can expect that, the more requests we send every second, the more Lambda instances will be launched – but only when the current number of current instances is insufficient. In 3 phases, we slowly increase the load. We start out with 1 request per second, then 5 requests per second, and finally 20 requests per second. Each of these phases takes 5 minutes – which is plenty to ensure the number of container instances is stable.
Results
We downloaded the logs from CloudWatch and used a Python script to find request durations and group the cold starts and reused instances. We then used the Plotly Python Graphing library to plot the duration of each request, so we can compare the two groups.
The response times of reused Lambda instances is comparable. Both the Code and the Container Deployments had a consistent request duration, handling all requests in just over 1 second. This makes sense, as we explicitly sleep for 1 second during the request.
When comparing the cold start times, the results are more surprising! On average, the Container Deployment seems to perform slightly better than the Code Deployment, at the cost of consistency. Where 95% of the requests for the Code Deployment are in the range of 6.7-7.25 seconds, the Container Deployment had a much wider variance: from 5.9 to 7.5 seconds. In both cases, the startup time is quite long, for which Java is somewhat notorious.
Conclusions
A simple Java application has very similar performance on AWS Lambda when deployed as a Container or as code. Both Container and Code Deployments were able to consistently handle subsequent requests quickly, but the cold start response time is still several seconds long – which might be too much if your application requires fast response times. If you can deal with the occasional longer request, developing your Lambda application might be easier with a Container deployment. Being able to invoke your Lambda function locally can speed up development and debugging, and you have full control over the environment your application runs in. For applications where this delay does matter, be sure to run your own tests, especially if you have a different runtime. If the difference is negligible, the container deployment is likely superior due to the added ease of development. The testing methodology used in this blog should easily carry over to larger applications and runtimes. This release opens up a whole new set of options. Whether you want a consistent environment, port existing applications, deploy your on different runtimes or deploy your machine learning model to a serverless environment, the release of Containers on Lambda will be a game changer for serverless development in many teams!

